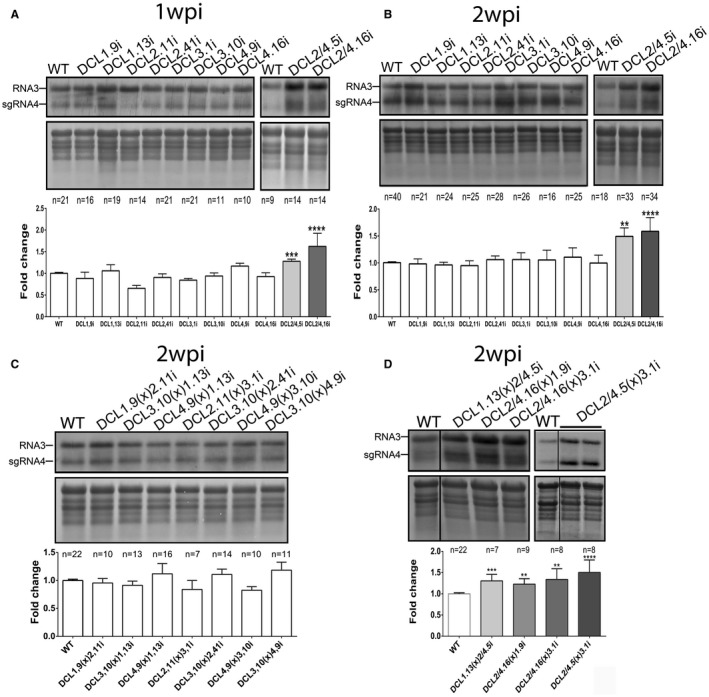
Figure 4.

Cucumber mosaic virus (CMV) infections in DCLi and DCLi crossed plants. Representative northern blots of CMV DCLi plant lines infected for 1 week post‐infection (wpi) (A) or 2 wpi (B), and DCLi crossed plants infected for 2 wpi (C, D). The CMV probe that recognizes part of the transcript of the coat protein (CP) was used (RNA3 and sgRNA4). Methylene blue staining was used as loading control. Graphs represent measurements performed with Quantity One 4.4.1 (Biorad). ‘n’ denotes the number of individual tested plants. Statistical significance was tested with one‐way analysis of variance (ANOVA) and Student’s t‐test. The P value was set at **P < 0.01, ***P < 0.001 and ****P < 0.0001. WT, wild‐type.
