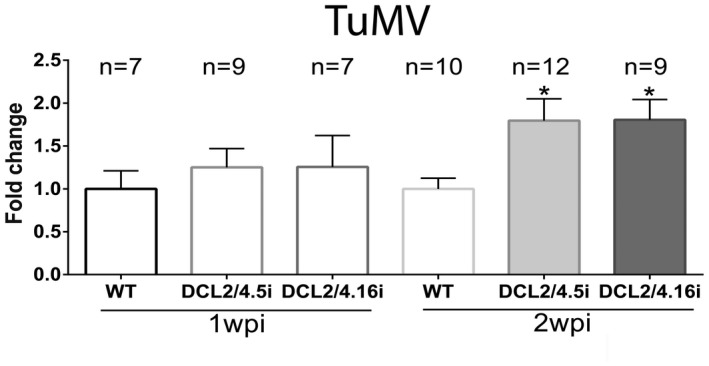
Figure 6.

Turnip mosaic virus (TuMV)‐infected DCL2/4i plants. Graph representing measurements with Quantity One 4.4.1 (Biorad) from three independent experiments of semi‐quantitative polymerase chain reaction (PCR) in DCL2/4i plants infected with TuMV for 1 or 2 weeks post‐infection (wpi). ‘n’ shows the number of individual tested plants. Student’s t‐test was performed with *P < 0.05.
