Figure 2.

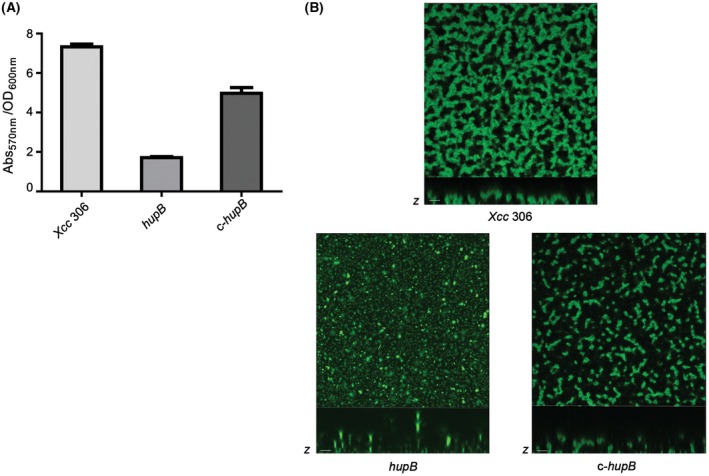
Biofilm formation analysis of the Xanthomonas citri ssp. citri (Xcc) hupB mutant strain. (A) Microtitre plate adhesion assay. Crystal violet absorbance (Abs570 nm) to OD600 ratio is represented for each strain: wild‐type strain (Xcc 306), null mutant strain (hupB) and the complemented strain (c‐hupB). Error bars indicate standard error of the mean of three independent experiments. (B) Biofilm structures after 4 days of inoculation: projections in the x–y plane were obtained through confocal laser scanning microscopy (CLSM) (40× magnification); z‐axis‐projected images are shown below (scale bars, 5 μm).
