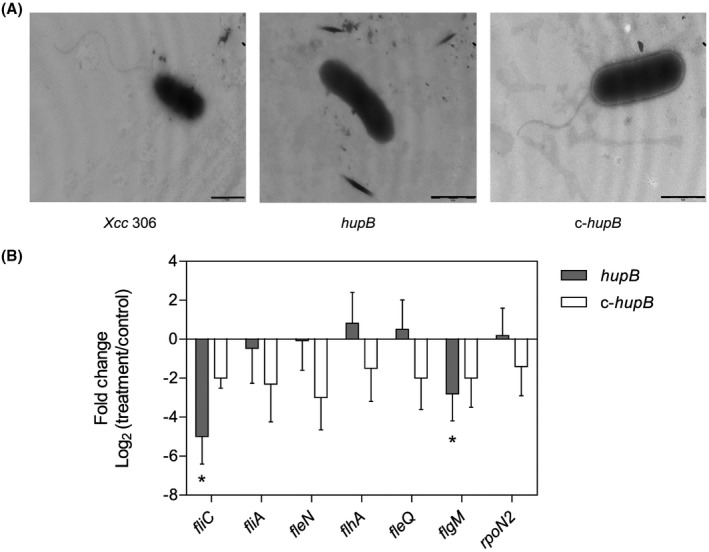
Figure 4.

Study of the flagellar structure in the hupB null mutant. (A) Images obtained by transmission electron microscopy of the flagellar structure of the wild‐type strain Xcc 306, hupB mutant strain and the c‐hupB strain. Bacteria were cultured in rich medium and harvested when the optical density at 600 nm (OD600) = 1. Scale bar, 0.5 μm. (B) The relative expression of flagellar genes (fliC, fliA, fleN, flhA, fleQ, flgM, rpoN2) between the treatment (hupB mutant strain or the c‐hupB strain) and the control (wild‐type strain Xcc 306) was estimated by quantitative reverse transcription‐polymerase chain reaction (qRT‐PCR). Data correspond to the average of four independent experiments; error bars indicate standard error. Significant difference between treatment and control is indicated by an asterisk (P < 0.05). Xcc, Xanthomonas citri ssp. citri.
