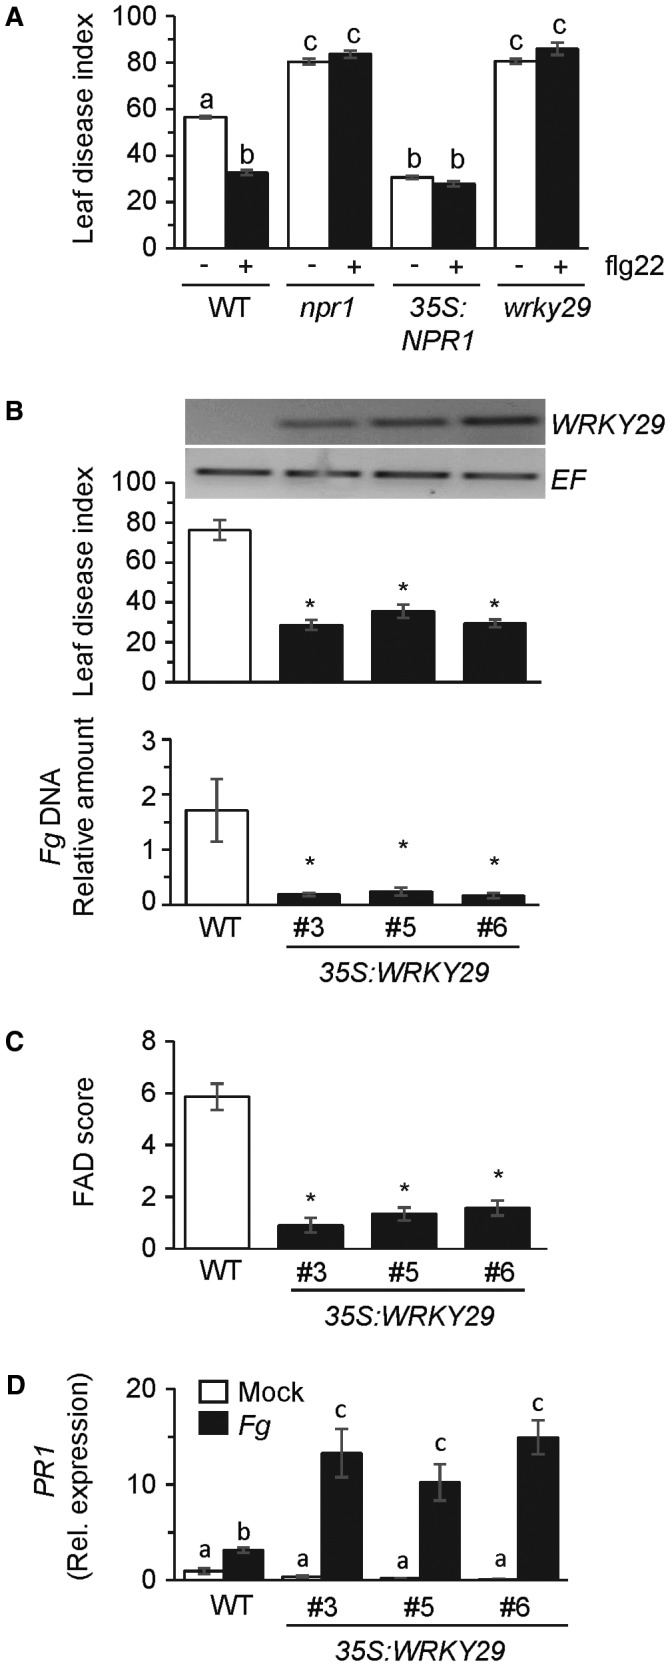
Figure 4.

Constitutive expression of WRKY29 in Arabidopsis promotes resistance to Fusarium graminearum (Fg). (A) Leaf disease index in Fg‐inoculated wild‐type (WT) accession Columbia, the npr1 mutant, a 35S:NPR1 transgenic line in which the NPR1 coding sequence is expressed from the 35S promoter, and a wrky29 mutant. Leaves were treated with 50 ng of flg22 peptide, or mock treated, 24 h prior to fungal inoculation. Disease was monitored at 5 days post‐inoculation (dpi). All values are the means ± standard error (SE) (n = 50). Different letters above the bars indicate values that are significantly different from each other (P < 0.05; Tukey’s test). (B) Top: reverse transcription‐polymerase chain reaction (RT‐PCR) demonstration of WRKY29 expression and, as control, At1g07940 (EF) expression in leaves of WT accession Columbia and three independent 35S:WRKY29 lines in which the WRKY29 coding sequence is expressed from the 35S promoter. Middle: leaf disease index in WT accession Columbia and 35S:WRKY29 lines inoculated with Fg. Disease was monitored at 5 dpi. All values are the means ± SE (n = 50). Asterisks above the bars indicate values that are significantly different from the WT (P < 0.05; χ 2 test). Bottom: real‐time PCR analysis (×10−2) of DNA content of Fg nahG gene relative to the Arabidopsis ACT8 gene. All values are means ± SE (n = 4) in leaves of WT Col‐0 and the 35S:WRKY29 plants at 4 dpi with Fg. Asterisks above the bars indicate values that are significantly different from the WT (P < 0.05; t‐test). (C) Fusarium Arabidopsis Disease (FAD) score for the WT accession Columbia and 35S:WRKY29 transgenic lines. All values are the means ± SE (n = 30). Asterisks above the bars indicate values that are significantly different from the WT (P < 0.05; t‐test). (D) Real‐time RT‐PCR evaluation of PR1 expression in mock‐ and Fg‐inoculated leaves of WT accession Columbia and 35S:WRKY29 transgenic lines. Gene expression relative to expression of the control gene At1g07940 was monitored at 24 h post‐treatment. All values are the means ± SE (n = 4). Different letters above the bars indicate values that are significantly different from each other (P < 0.05; Tukey’s test).
