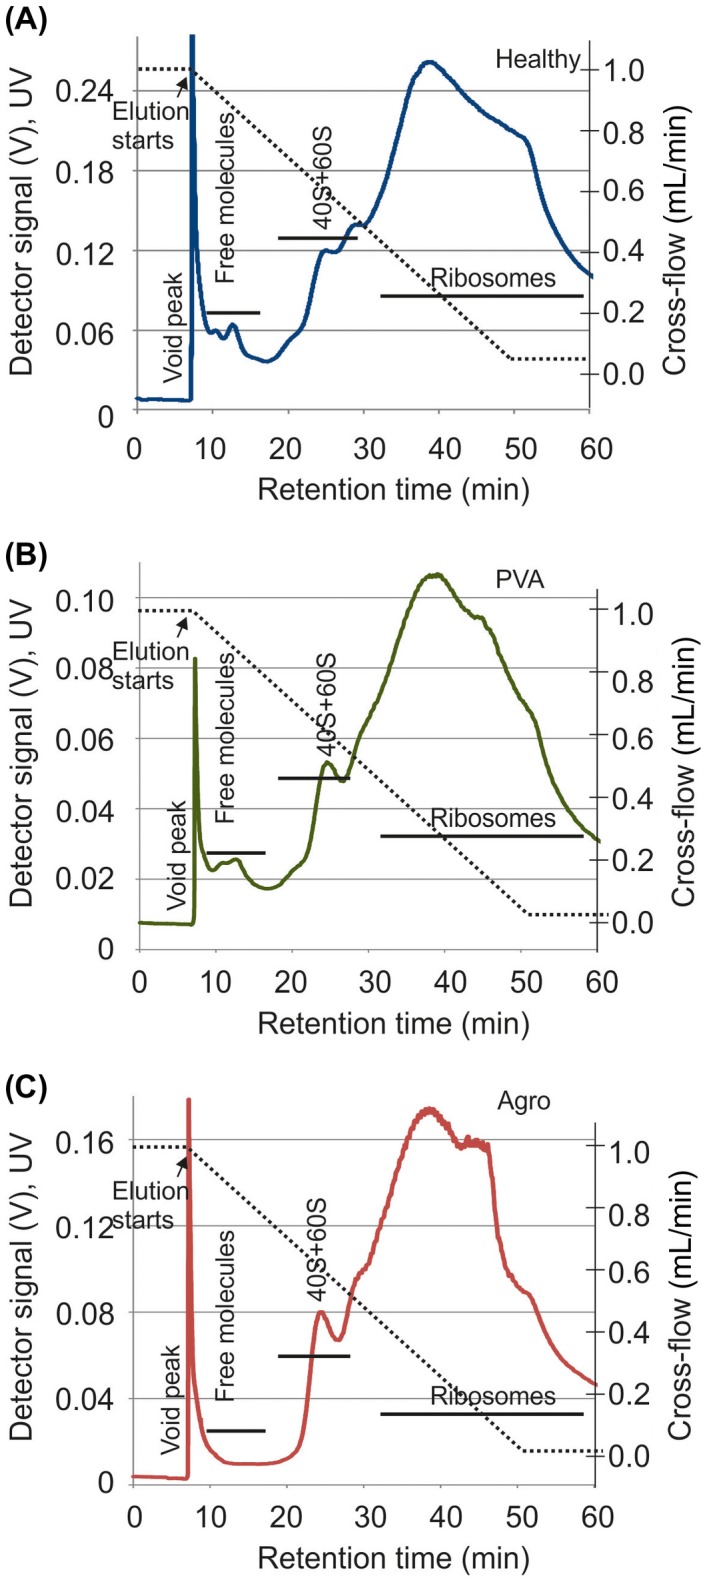
Figure 2.

Asymmetrical flow field‐flow fractionation (AF4) reveals that the ribosome profiles are alike in healthy and infected plants. P170K ribosome profiles were analysed from healthy (A), Potato virus A (PVA)‐infected (B) and Agrobacterium‐infected (C) N. benthamiana plants. Representative fractograms are shown. Samples were focused for 6 min prior to transition to a linearly decaying cross‐flow gradient from 1 mL/min to 0.05 mL/min (broken line). The peak at ~6 min is the void peak. Retention times for ribosomes were obtained from Pitkänen et al. (2014). The elution of sample components was followed using a UV detector by monitoring the intensity (V) at 254 nm (full lines). [Colour figure can be viewed at wileyonlinelibrary.com]
