Figure 1.

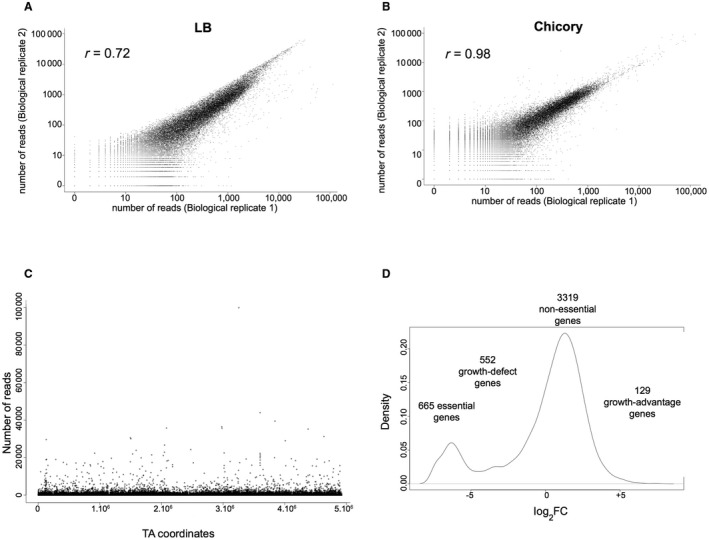
Quality control of the transposon sequencing (Tn‐seq) Dickeya dadantii 3937 libraries. (A, B) Biological reproducibility of the Tn‐seq results. Pairs of Tn‐seq assay results are compared, with the total number of reads per gene plotted. Analysis of DNA samples corresponding to two independent cultures of the mutant pool grown in Luria–Bertani (LB) medium (correlation coefficient r = 0.72) (A) and chicory (correlation coefficient r = 0.98) (B). Values represent average numbers of reads per gene from the pairs of biological replicates. (C) Frequency and distribution of transposon sequence reads across the entire D. dadantii 3937 genome. The localization of transposon insertions shows no bias throughout the genome of D. dadantii 3937. (D) Density plot of log2 fold change (log2FC; measured reads/expected reads per gene).
