FIGURE 1.
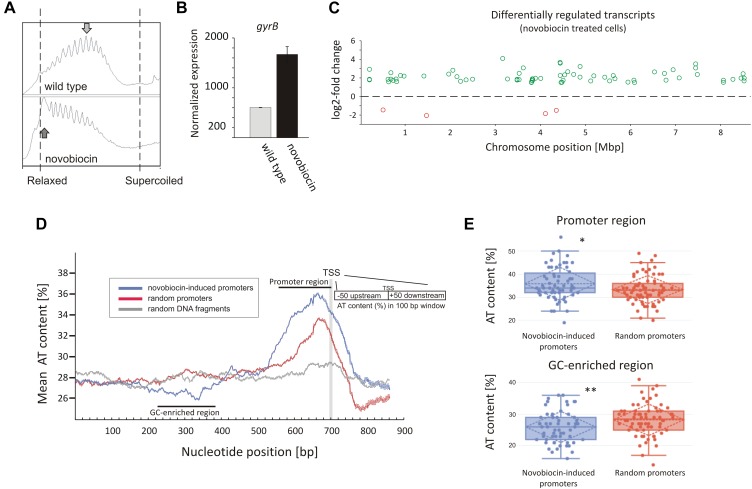
Identification of novobiocin-sensitive genes in S. coelicolor. (A) Analysis of reporter plasmid supercoiling density. The reporter plasmid was isolated from untreated wild type strain (upper panel) and the same strain exposed to novobiocin (10 μg/mL) for 10 min (bottom panel). The most abundant topoisomers identified under each condition are marked with arrows. (B) RNA-Seq based gyrB expression normalized by the upper quartile, in the untreated wild type strain (gray) and the novobiocin-treated strain [as described for panel (A)] (black). (C) The chromosomal localization of the novobiocin-sensitive genes. Differentially upregulated (green) and downregulated (red) transcripts in the S. coelicolor culture following novobiocin exposure (as in panel A) were identified using log2-fold changes >1.5; p-value <0.05 thresholds. (D) Analysis of the average AT content in the promoter regions of novobiocin-sensitive genes (blue) in comparison to the random promoters (red) and random chromosomal sequences (gray). The transcriptional start site (TSS), promoter region and GC-enriched region identified upstream of novobiocin-sensitive promoters are marked. (E) The box plot comparison of AT content within the promoter region (upper panel) and GC-enriched region (bottom panel) of novobiocin-sensitive (blue) and randomly selected (red) promoters. The asterisks indicate the calculated p-value <0.05 (∗) or <0.01 (∗∗).

