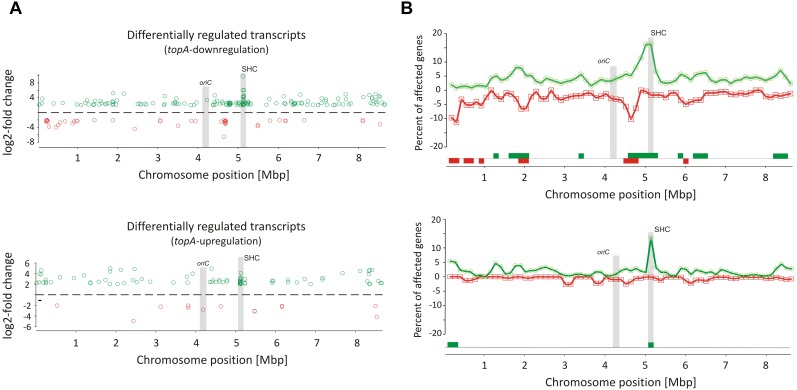
FIGURE 3.
Identification of long-term supercoiling imbalance-sensitive clusters. (A) The chromosomal positions of differentially upregulated (green) and downregulated (red) transcripts identified in the topA-downregulated strain (upper panel) and topA-upregulated strain (lower panel). The positions of the oriC region and the supercoiling-hypersensitive cluster (SHC) are marked in gray. (B) Identification of supercoiling-sensitive clusters. The percent of genes affected by topA downregulation (upper panel) or topA upregulation (lower panel) was calculated in a 250-kbp window and the mid of the window was plotted versus chromosome position. The regions with the percentage of upregulated (green) or downregulated (red) genes higher than 5% (supercoiling-sensitive clusters) are marked at the bottom of the plot.

