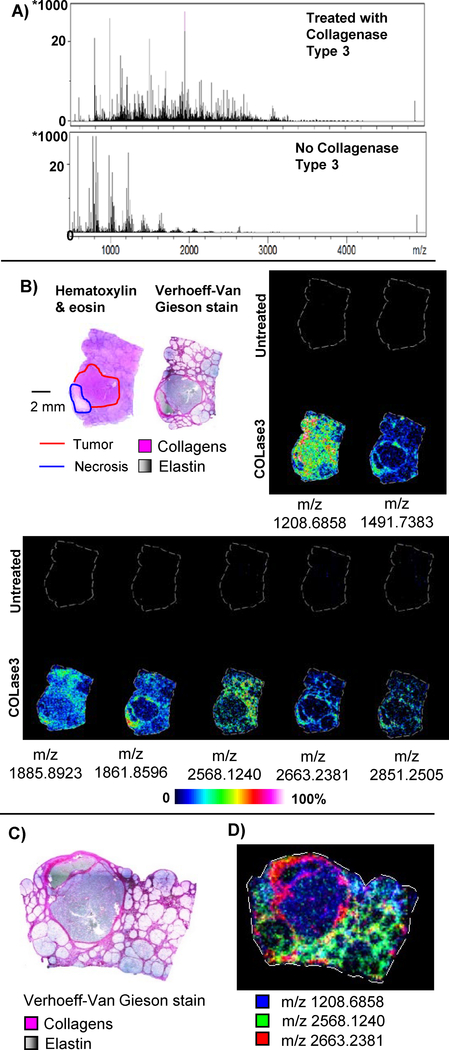
Figure 2.
Collagenase Type III Image Data. A) Representative total ion current across an entire section of liver tissue. Typical high intensity clusters of matrix peaks are observed in the control section that was identically treated except for the addition of COLase3. B) Representative images from select peaks. In each image, the top section is the control. Red line represents tumor region; blue line represents necrotic region. C) Verhoeff Van Gieson stain for collagens. Collagen is hot pink, elastin is black to gray. D) Combined ion image showing distinct unique patterns mapping to collagenous regions.

