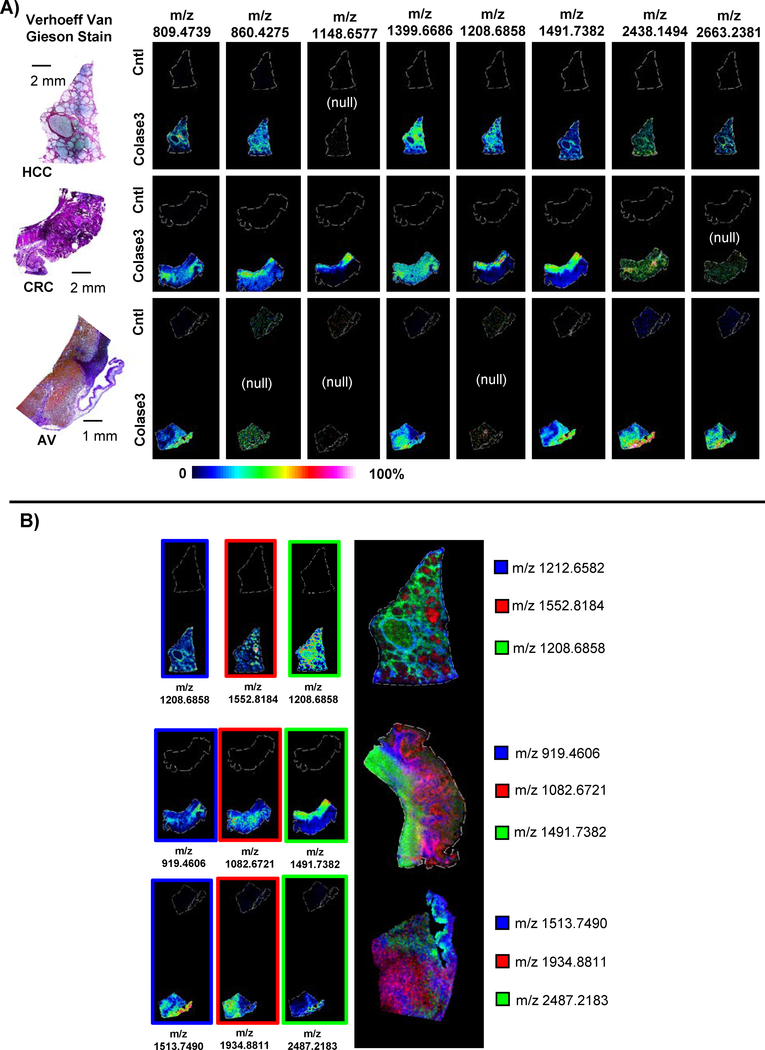
Figure 3.
Examples of COLase3 image data across tissue types. A) Comparison of same masses across tissues. Some peaks were not detected in certain tissue types (marked “null”), suggesting that distinct COLase3 produced peaks will be useful in assessing biological variability. B) Combined Images illustrating distinct localization of COLAse3 produced peptides across tissue types.

