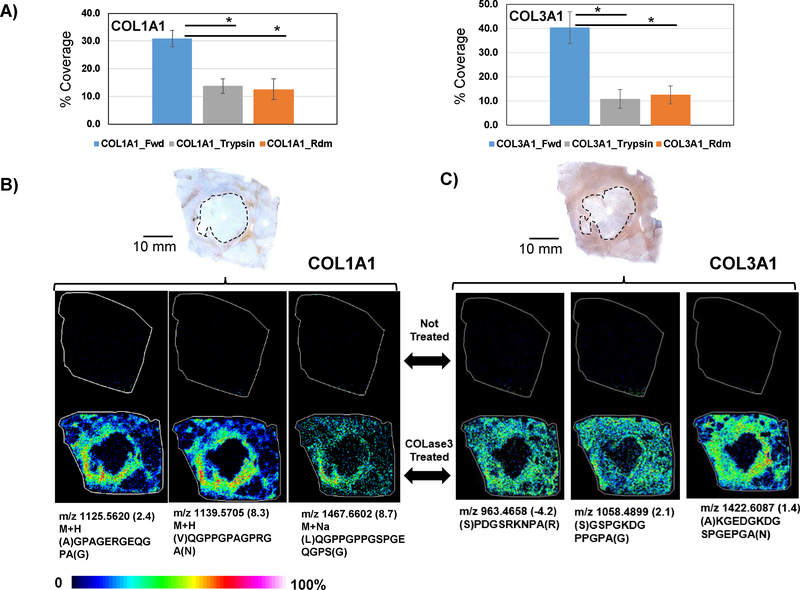
Figure 5.
Peptide mass fingerprint matches to collagens identified by proteomics. A) In silico digestion studies using image data coverage showing that COLase3 digestion produces significantly higher sequence matches to COL1A1 and COL3A1 compared to in silico generated tryptic peptides or random sequence collagen. B) COL1A1 antibody staining shows COL1A1 closely encircling the tumor (dashed line), which is repeated in the image data by peptides linked to COL1A1 through PMF. C) COL3A1 antibody staining shows high expression in most tissue surrounding the tumor (dashed line), which is also repeated in the image data by peptides linked to COL3A1 through PMF studies. Asterisk indicates student’s t-test p-value ≤0.02.

