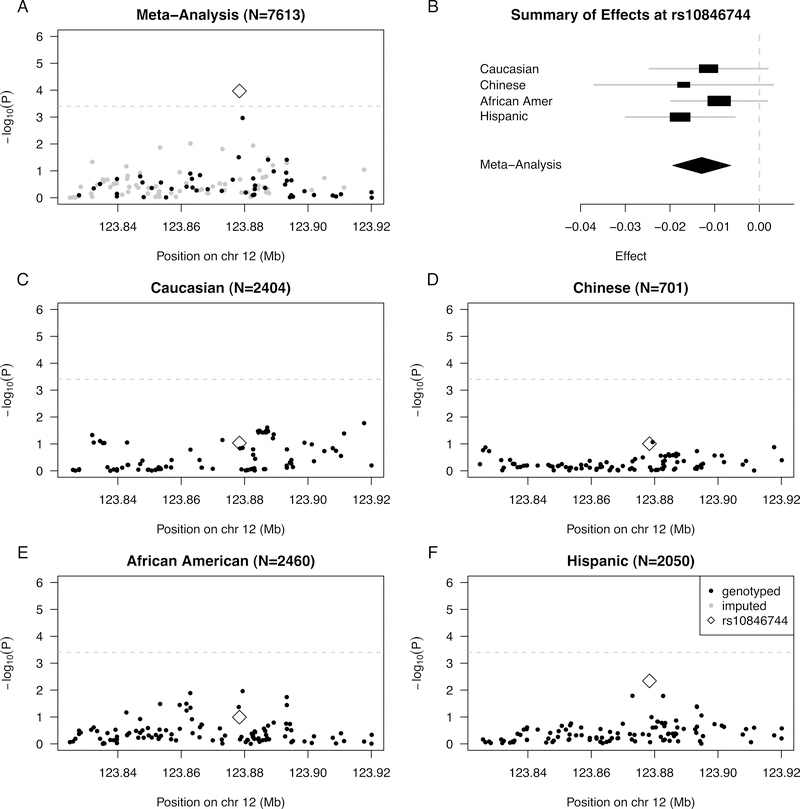
Figure 1:
Summary of regional association for SNPs in the SCARB1 gene region with common IMT (modeled on a log scale): (A) Strength of association versus SNP position on chromosome 12 based on meta-analysis to combine results from the four MESA racial/ethnic groups; (B) Forest plot of effects (with 95% CIs) reported in stratified analysis of the four MESA racial/ethnic groups; and Strength of association versus SNP position on chromosome 12 based on stratified analysis of (C) Caucasians, (D) Chinese, (E) African Americans, and (F) Hispanic. In plots (A) and (C-F), genotyped SNPs are indicated as solid black dots, imputed SNPs as solid gray dots, the genotyped SNP rs10846744 as an open black diamond, and horizontal dashed gray lines indicate a conservative Bonferroni-threshold for statistical significance based on multiple testing of 126 SNPs.

