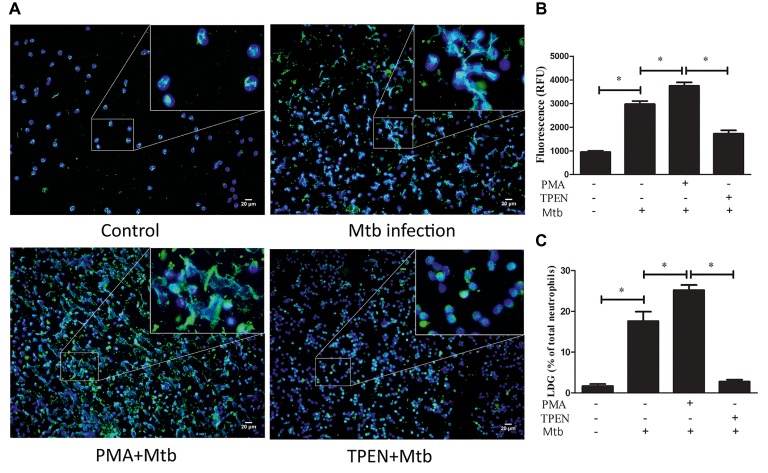
Figure 5.
The levels of NET release regulate the conversion of NDGs to LDGs upon M. tuberculosis infection. NDGs were isolated from healthy controls, and either untreated or pretreated with TPEN (10 μM) or PMA (20 nM) for 30 min, followed by infection with M. tuberculosis (Mtb) for 2 h at the MOI of 5. (A) The release of NETs was detected by immunofluorescence staining. Nuclei were stained with DAPI (blue), and MPO (green) was detected with specific antibody. The dual-labeled immunofluorescence staining is shown as a merged figure at ×200. (B) The levels of cfDNA in the culture supernatant were determined by QuantiFluor dsDNA System, and results are expressed as mean ± SD of at least three independent experiments. (C) Neutrophils were washed three times and resuspended in 3 ml of sterile saline, and then added into 3 ml of freshly collected autologous whole blood. PBMCs in this mixture and a proportion of untreated autologous peripheral blood were immediately isolated by Ficoll density gradient centrifugation. LDGs in these PBMCs were identified as CD14low CD15+ cells and counted by FCM. The number of LDGs in these mixtures was calculated by subtracting the number of LDGs in the untreated blood with LDGs in the mixture. The results are expressed as mean ± SD of at least three independent experiments, and the statistical significance was determined by one-way ANOVA followed by post hoc test (*p < 0.05).

