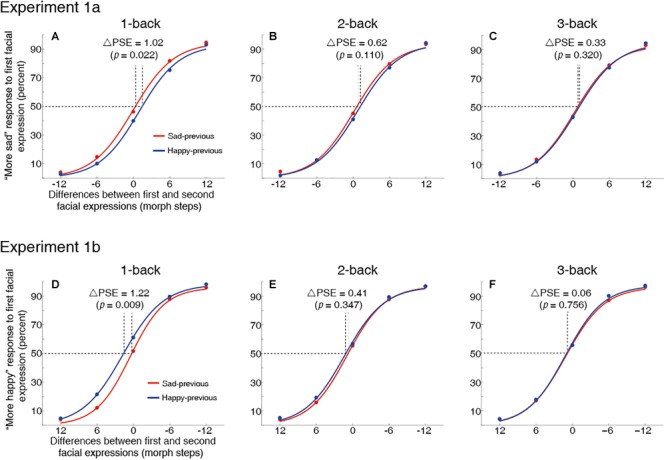
FIGURE 3.

Grand average psychometric functions for Experiment 1a (top panel) and 1b (bottom panel). The horizontal coordinate represents the differences between the first and second facial expressions in the morph continuum. Trials in the –6 and –12 bin denote that the second facial expression displayed more sad (or less happy) than the first facial expression; trials in the 6 and 12 bin denote that the second facial expression displayed less sad (or more happy) than the first facial expression; trials in the 0 bin denote the same first and second facial expressions. Note that, for comparison, Experiment 1a and 1b have an opposite direction on the horizontal coordinate values. The vertical coordinate represents percent of the first facial expression chosen as more sad (Experiment 1a) or more happy (Experiment 1b) on the corresponding five bins. The red and blue curves represent the fitting curves for the “sad-previous” and “happy-previous” trials, respectively. ΔPSE denotes the differences of in PSE values (i.e., magnitude of serial dependence effects) between the “sad-previous” trials and the “happy-previous” trials. One-back, two-back and three-back serial dependence effects are shown separately in the top panel (A–C) for Experiment 1a and in the bottom panel (D–F) for Experiment 1b. See Procedure and Analysis for more details.
