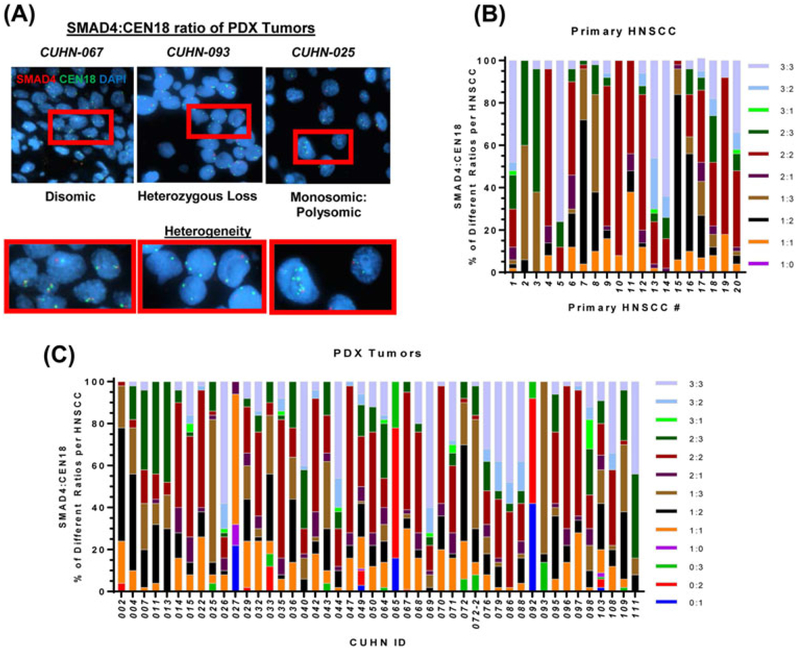
FIGURE 2.
Intra- and Inter-tumor heterogeneity of genomic SMAD4 and centromere 18. A) Representative SMAD4 FISH images of CUHN-067, −093, and −025 from left to right showing heterogeneity. Red boxes are magnified images. Subpopulations were defined by variations in copy numbers for SMAD4 and CEN18, to identify 10 unique subpopulations across all 20 primary HNSCCs (B) and 13 unique subpopulations across all 46 PDX tumors (C). The SMAD4:CEN18 subpopulations were organized by size (%) within each tumor specimen. [Color figure can be viewed at wileyonlinelibrary.com]

