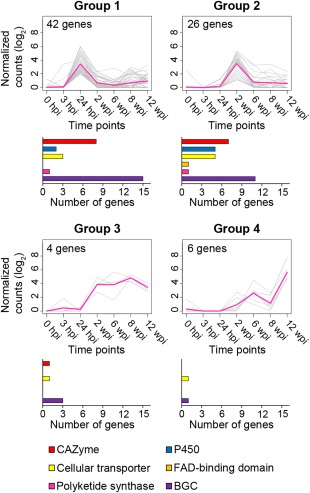
Figure 5.

Expression profiles of four groups of genes sharing a similar expression pattern during in planta colonization of grape stems. Groups were obtained by performing a K‐means clustering analysis using the 78 differentially expressed (DE) genes expressed in planta. Each single line represents the log2‐transformed average of the normalized counts for an individual transcript. Histograms show the counts of genes belonging to each virulence factor category [i.e. carbohydrate‐active enzyme (CAZyme), P450, cellular transporter, FAD‐binding domain, polyketide synthase (PKS) and part of biosynthetic gene cluster (BGC)].
