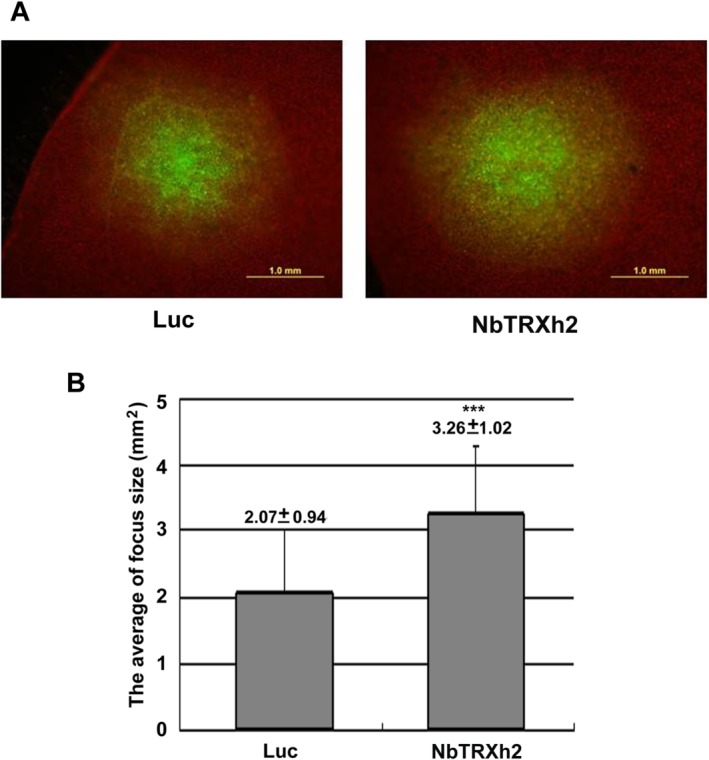
Figure 4.

Cell‐to‐cell movement of Barley mosaic virus (BaMV) in Luc‐ and NbTRXh2‐knockdown plants. (A) Areas of green fluorescent protein (GFP) foci on pCBG (infectious BaMV cDNA viral vector which can express GFP)‐inoculated Nicotiana benthamiana leaves at 5 days post‐inoculation, measured by fluorescence microscopy. Bar length, 1.0 mm. (B) Statistical analysis of the results obtained from (A); y‐axis is the GFP focus size (mm2). The numbers shown above the bars are the average and standard deviation of 24 and 35 foci from Luc‐ and NbTRXh2‐knockdown plants, respectively. Asterisks indicate statistically significant differences of the indicated group analysed by Student's t‐test (***P < 0.001).
