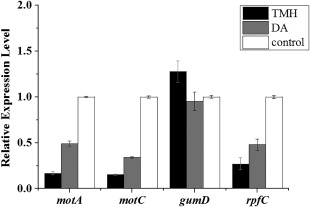
Figure 8.

Real‐time polymerase chain reaction (PCR) analysis of motA, motC, gumD and rpfC expression in Xanthomonas oryzae pv. oryzae cells in response to 0.48 mg synthetic decyl alcohol (DA) or 2.4 mg 3,5,5‐trimethylhexanol (TMH) for 24 h. Values were normalized to the levels of 16S rRNA, an internal reference gene. The y‐axis values represent the mean expression ± standard deviation (n = 3) relative to the control.
