Figure 6.

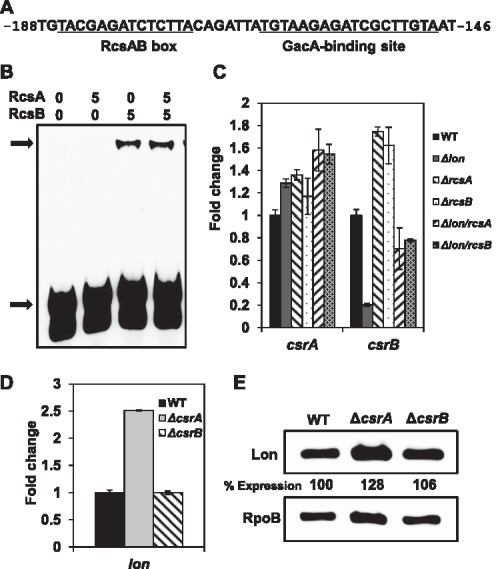
RcsA/RcsB accumulation suppresses csrB sRNA expression and the effect of csrA mutation on the lon gene. (A) The consensus RcsA/RcsB box and GacA‐binding site on the csrB upstream region. Numbers refer to the nucleotide position relative to the start site of the csrB gene. (B) Electrophoretic mobility shift assay for a 58‐bp fragment of the csrB upstream region and RcsA/RcsB proteins. Black arrows at the bottom and top indicate the free probe and the protein–DNA complex, respectively. The concentration of RcsA and RcsB (pmol) is indicated above each lane. (C) Relative gene expression of csrA and csrB in the lon, rcsA, rcsB, lon/rcsA and lon/rcsB mutants compared with the wild‐type (WT) grown in MBMA medium for 18 h at 28 °C. (D) Relative expression of lon in the csrA and csrB mutants compared with the WT grown in MBMA medium for 18 h at 28 °C. The values of the relative fold change are the means of three replicates and the experiment was repeated twice with similar results. Error bars indicate standard deviation. (E) Abundance of Lon‐His6 protein in the csrA and csrB mutant strains compared with the WT grown in MBMA for 18 h at 28 °C. The abundance of the RpoB protein was used as a loading control. Relative protein abundance at the bottom of each lane was calculated using ImageJ software. Cropped gel blots and percentage expression values are representatives of three independent experiments.
