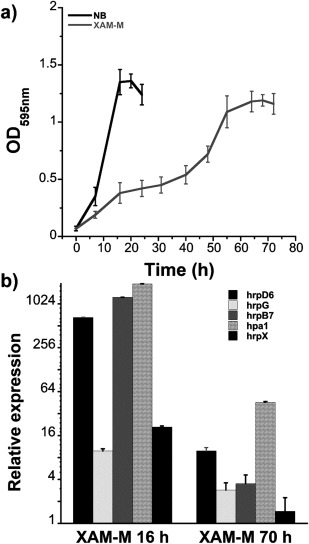
Figure 1.

Xanthomonas citri ssp. citri (XAC) growth curves in nutrient broth (NB) and XAM‐M medium, and relative hrp mRNA expression induced by XAM‐M medium. Growth curves [optical density at 595 nm (OD595 nm) vs. time] were based on the average of four independent experiments (a); quantitative reverse transcription‐polymerase chain reaction (qRT‐PCR) analysis of hrp genes as relative mRNA expression (relative to NB, control, for 17 h) on XAM‐M for 16 h and 70 h (b). Error bars indicate standard deviation from the biological replicates.
