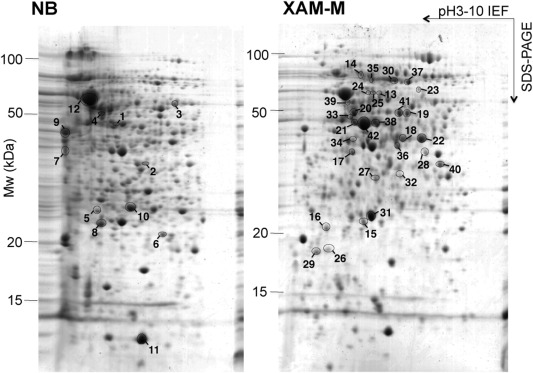
Figure 2.

Two‐dimensional gel electrophoresis (2‐DE) of Xanthomonas citri ssp. citri (XAC) periplasmic‐enriched protein fraction. Proteins from the periplasmic‐enriched fraction of XAC grown in nutrient broth (NB) or XAM‐M medium were separated by 2‐DE. The numbered circles represent protein spots with significantly different abundance in XAM‐M relative to NB (P < 0.05). Spots with increased and decreased abundance in XAM‐M are indicated on the right (XAM‐M) and left (NB) gels, respectively. The best‐resolved central region of the 2‐DE gel is shown.
