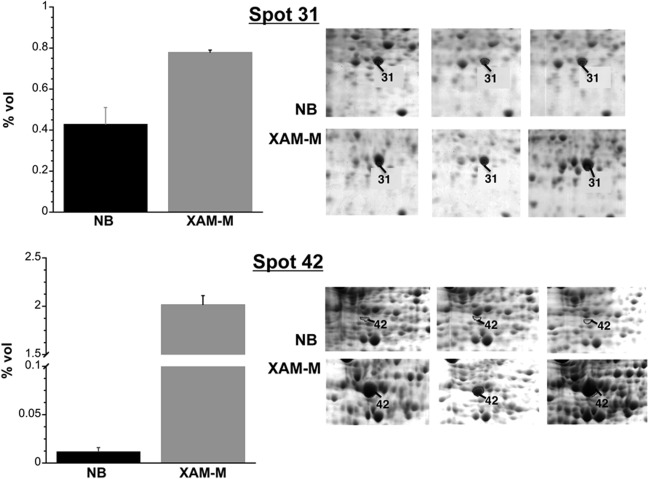
Figure 3.

Differential abundance of superoxide dismutase (SOD) and spot 42. Data represent the mean of three independent experiments, and error bars indicate standard deviation. Details of the two‐dimensional gel electrophoresis (2‐DE) gel triplicates are shown in the right panels.
