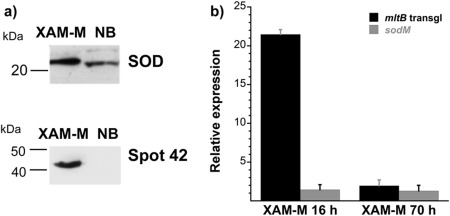
Figure 4.

Expression analysis of superoxide dismutase (SOD) and spot 42 protein(s)/MltB. Immunoblot for SOD and spot 42 proteins using the respective antibodies (a); quantitative reverse transcription‐polymerase chain reaction (qRT‐PCR) of the relative mRNA expression (relative to NB, control, at 17 h) for Xanthomonas citri ssp. citri (XAC) transglycosylase (mltB) and SOD (sodM) on XAM‐M for 16 and 70 h (b). Error bars indicate standard deviation from biological replicates. Molecular mass markers are indicated on the left of the gels in (a).
