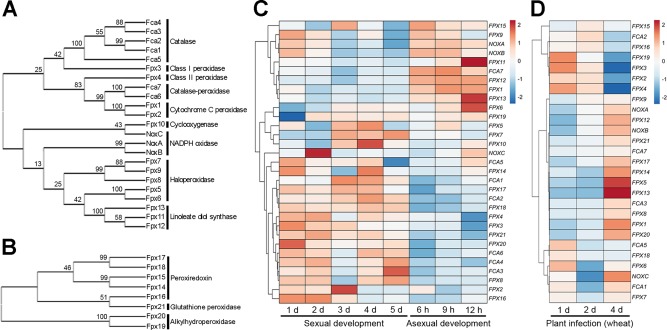
Figure 1.

Phylogenetic and transcriptional analysis of peroxidase genes. Phylogenetic trees based on the amino acid sequences of 23 putative haem peroxidases (A) and eight putative non‐haem peroxidases (B) in Fusarium graminearum. The phylogenetic trees were constructed using the mega program (version 6.06) by the neighbour‐joining method with 2000 bootstrap replicates (Tamura et al., 2013). The numbers at the nodes represent the bootstrap percentages. (C, D) Heatmap visualization of the peroxidase gene transcriptional profiles during asexual and sexual development (C) and plant infection (D). The heatmap depicts peroxidase gene transcript abundances during various asexual and sexual developmental stages based on log2‐based relative transcript abundances compared with the 0‐day (sexual development), 3‐h (asexual development) and mock‐inoculated (plant infection) samples. Red and blue represent higher and lower expression, respectively. The rows represent transcriptional units. The expression data were obtained from previous studies (Harris et al., 2016; Sikhakolli et al., 2012; Son et al., 2013, 2016) and visualized using ClustVis (Metsalu and Vilo, 2015).
