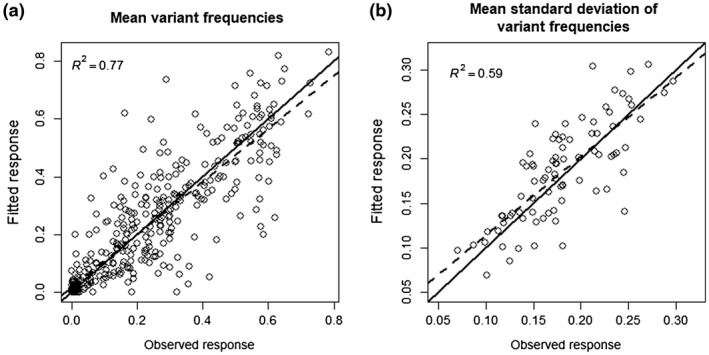
Figure 1.

Goodness of fit of a Wright–Fisher model with selection and genetic drift with the experimental dataset. (a) Correlation between the observed mean frequencies of each of the five virus variants in the population and their fitted values [n = 420; 84 doubled‐haploid (DH) lines, five values per DH line]. (b) Correlation between the observed means of the standard deviation of variant frequencies and their fitted values (n = 84; one value per DH line). In both panels, the black line is the first bisector and the dashed line is the best‐fitting linear model for which the coefficient of determination R² is indicated.
