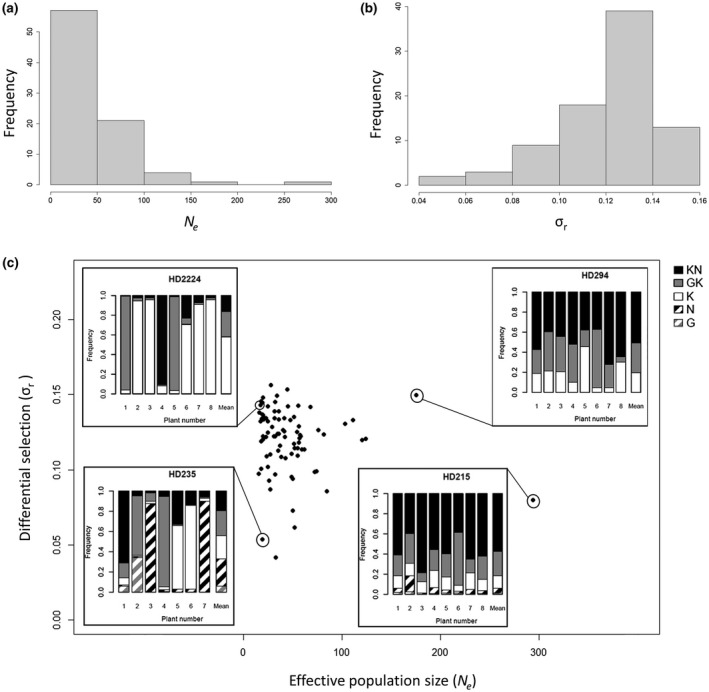
Figure 3.

Distribution of differential selection and effective population size values in Potato virus Y (PVY) populations in 84 pepper lines. (a) Distribution of the effective population size (N e). (b) Distribution of differential selection (σ r). σ r is the standard deviation of the relative growth rates ri of the five variants composing the PVY population. (c) Distribution of the 84 pepper doubled‐haploid (DH) lines according to N e and σ r. For four DH lines with contrasted N e and σ r values, bar plots illustrating the composition of the PVY population at 21 days post‐inoculation are provided. For each DH line, each of the first seven or eight bars represents the frequencies of the five PVY variants (G, N, K, GK and KN) in a single plant initially inoculated with a similar amount of the five variants. The last bar represents the mean frequencies of the five PVY variants among plants.
