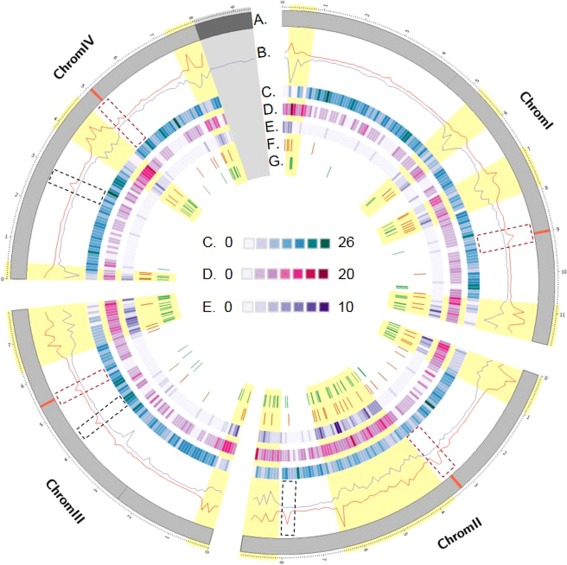
Figure 4.

Circos plot of the distribution of several genomic sequence features along the four chromosomes of Fusarium graminearum. (A) Representation of the four chromosomes of F. graminearum (in Mb); the red segments delimit the positions of the predicted centromeres. (B) In red, the single nucleotide polymorphism (SNP) density (SNP/kb) is calculated in windows of 100‐kb bins along the parental genomes. In blue, the number of COs is calculated in separate windows of 100‐kb bins across the progeny. The dashed rectangular boxes show the typical patterns observed at centromere positions; the dashed black boxes show the centromere‐like patterns. Recombination‐active sections are highlighted in yellow. (C) Protein‐coding genes expressed constitutively in all in planta conditions tested conditions (Harris et al., 2016). (D) Protein‐coding genes expressed in host‐specific conditions (Harris et al., 2016). For (C) and (D), the gene density was calculated in 100‐kb bin windows. (E) Location of genes predicted to code for secreted proteins (Brown et al., 2012; King et al., 2015). (F) Location of predicted secondary metabolite clusters (Sieber et al., 2014). (G) Location of genes showing evidence of diversification.
