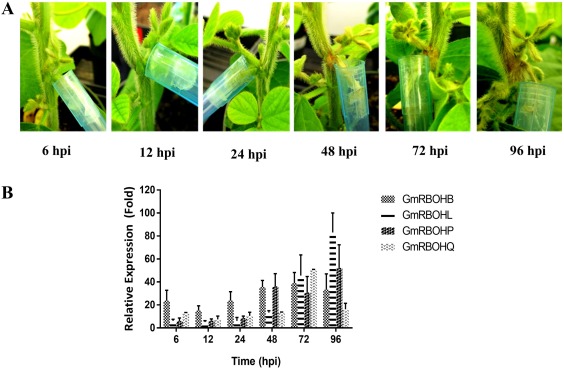
Figure 3.

Disease progression and expression profiles of GmRBOH‐VI following infection with Sclerotinia sclerotiorum. (A) Disease symptoms observed following petiole inoculation with an agar plug containing actively growing mycelia of S. sclerotiorum at 6, 12, 24, 48, 72 and 96 h post‐inoculation (hpi). (B) RNAs isolated from non‐infected and infected soybean stems were employed to analyse the expression of GmRBOH‐VI using quantitative reverse transcription‐polymerase chain reaction (qRT‐PCR). The relative expression values were calculated by comparing the expression values of genes in inoculated vs. non‐inoculated soybean stem tissues using the 2−ΔΔ Ct method. GmCons15 was used as an endogenous control. Data are presented as means ± standard error (SE) from three independent experiments.
