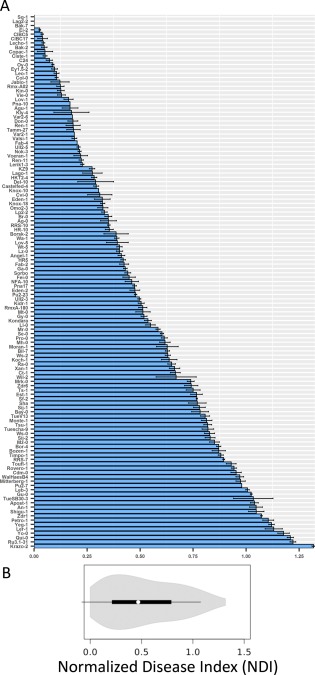
Figure 1.

Natural variation in disease resistance to Alternaria brassicae in 123 accessions of Arabidopsis thaliana. (A) Normalized disease index (NDI) scores of the 123 accessions used in the study. The mean and standard error are shown (n ≥⩾ 12). (B) Violin plot (box‐and‐whisker plot overlaid with a kernel density plot) of the phenotypic variation in the collection of 123 accessions.
