
Figure 5.
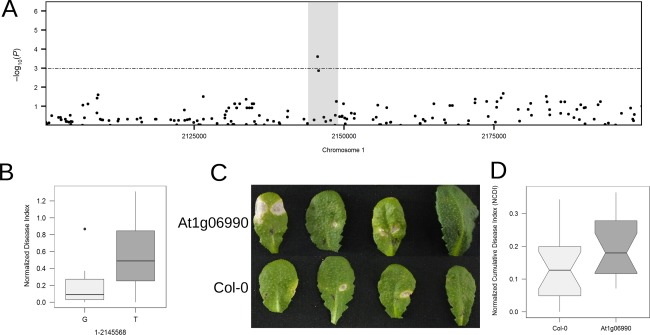
Functional analysis of the gene At1g06990. (A) Local association plot (accelerated mixed model, AMM) zoomed in on region 2 (chromosome 1) containing the gene At1g06990. (B) Boxplot of normalized disease index (NDI) sorted by the alleles (G and T) at the single nucleotide polymorphism (SNP) position Chr1‐2145568. (C) Representative images of infected leaves of the mutant (At1g06990) and wild‐type (Col‐0) at 7 days post‐infection (dpi). (D) Boxplot showing normalized cumulative disease index (NCDI) of wild‐type (Col‐0) and mutant.