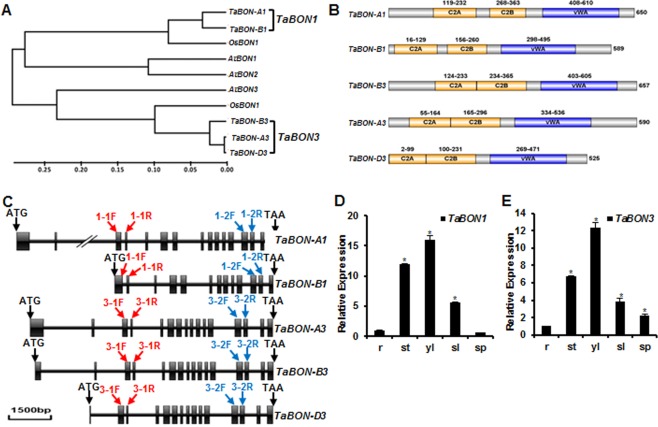
Figure 1.

Phylogenetic tree, domain organization and tissue expression pattern of TaBON1 and TaBON3. (A) Neighbour‐joining tree of copine family members from Arabidopsis thaliana (At), Oryza sativa (Os) and Triticum aestivum (Ta) generated by MEGA5.02 software. The inferred phylogeny was tested by 1000 bootstrap replicates. The scale bar indicates the branch length. (B) Conserved domains identified in SMART and displayed on the IBS1.0.2 program (http://ibs.biocuckoo.org/download.php). Numbers represent the amino acid residues in the domain or the whole protein. (C) Diagram of gene structure of TaBON1 and TaBON3. Boxes and lines represent exons and introns, respectively. The red arrows indicate the primer sites for the amplification of fragments used in virus‐induced gene silencing (VIGS) constructs of TaBON1 and TaBON3. The blue arrows indicate the primer sites for quantitative reverse transcription‐polymerase chain reaction (qRT‐PCR) to check the expression of TaBON1 or TaBON3. 1‐1F stands for TaBON1‐1F, 3‐1F for TaBON3‐1F, and so on. (D, E) qRT‐PCR analysis of TaBON1 (D) and TaBON3 (E) expression levels in various tissues, including the root (r), stem (st), young leaf (yl) (McCouch et al., 2013), senescent leaf (sl) and spike (sp). The expression is normalized by the expression level in the root. TaActin was used as the internal control. Similar results were seen in all three biological replicates and one biological experiment with three technical repeats is shown. Asterisks indicate statistically significant differences in comparison with the root at P ≤ 0.01 (Student's t‐test).
