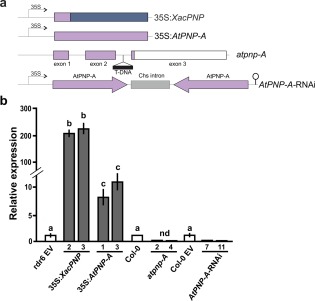
Figure 1.

Construction of Arabidopsis thaliana lines with modified levels of plant natriuretic peptides (PNPs) and the analysis of PNP expression. (a) Schematic representation of the constructions used to obtain the transgenic lines. AtPNP‐A sequences are represented in light violet and XacPNP in blue. (b) Relative expression of PNPs analysed by quantitative reverse transcription‐polymerase chain reaction (qRT‐PCR) of selected lines of transgenic plants and compared with the endogenous AtPNP‐A levels in control plants. rdr6 EV denotes Col‐0 rdr6‐11 bearing pCHF3, and Col‐0 EV denotes Col‐0 with pFGC5941 (EV, empty vector). nd, not detected. Values are the means of three biological replicates with three technical replicates each. Error bars indicate standard deviations. The data were analysed by analysis of variance (ANOVA) followed by Tukey's test. Bars with different letters are significantly different (P < 0.05).
