Figure 2.

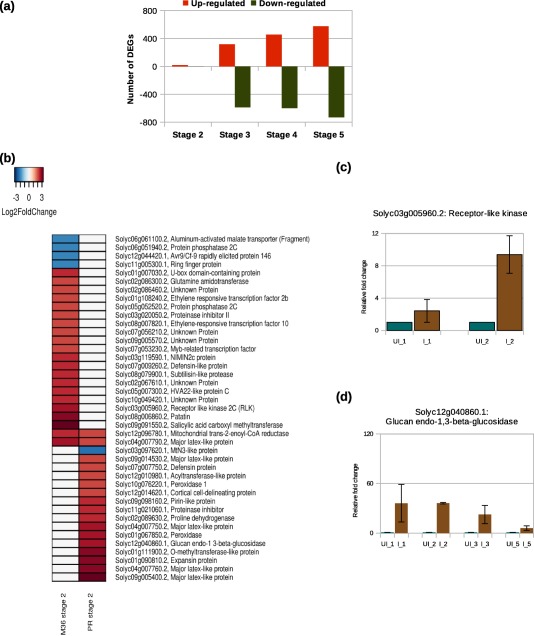
(a) Distribution of significant differentially expressed genes (DEGs) in tomato at different stages during the susceptible response. (b) Comparative expression profile of tomato DEGs detected during the susceptible (Pusa Ruby, PR) and resistance (transgenic Money Maker, M36) responses at stage 2. Differential expression was calculated with respect to the corresponding uninfected controls. Each row of the heatmap represents a gene and each column represents a stage of disease development. The colour key is given in the top‐left corner of the figure. (c, d) Quantitative reverse transcription‐polymerase chain reaction (qRT‐PCR) validation of RNA sequencing (RNA‐seq) data for the tomato genes, receptor‐like kinase and glucan endo‐1,3‐β‐glucosidase, during resistance and susceptible responses, respectively. The y axes represent the relative fold change (calculated using the ΔΔCt method) in gene expression at various stages relative to the corresponding uninfected controls. The data are representative of two technical replicates and three independent biological replicates. Bars indicate standard errors. I, infected; UI, uninfected.
