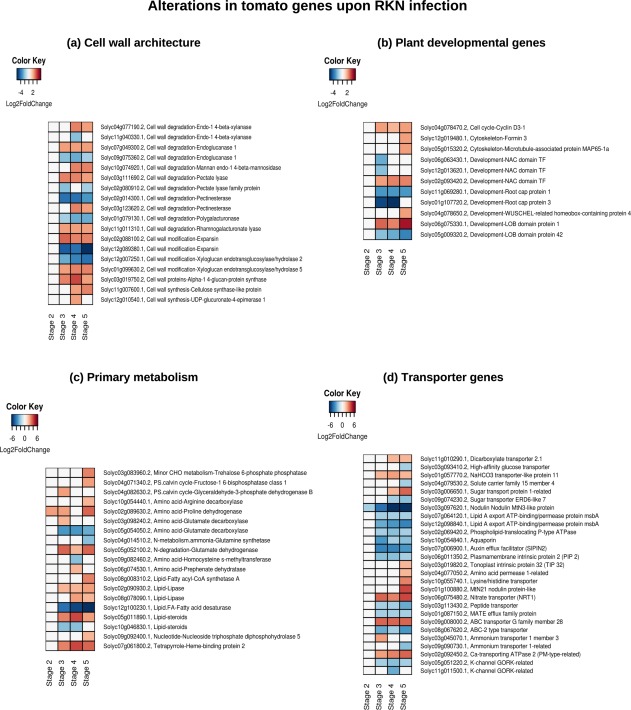
Figure 3.

Schematic representation of the gene expression patterns of subsets of tomato differentially expressed genes (DEGs) involved in plant cell wall architecture (a), development (b), primary metabolism (c) and transporter genes (d) in the susceptible response. The heatmap represents only a subset of genes from each category (consult Supporting Information for the expression of all DEGs involved in each category). Each row represents a gene and each column represents a stage of disease development. Labels on the right side of the heatmap show the gene id, category to which it belongs, followed by the annotation. The colour key is given in the top‐left corner of the heatmap. RKN, root‐knot nematode.
