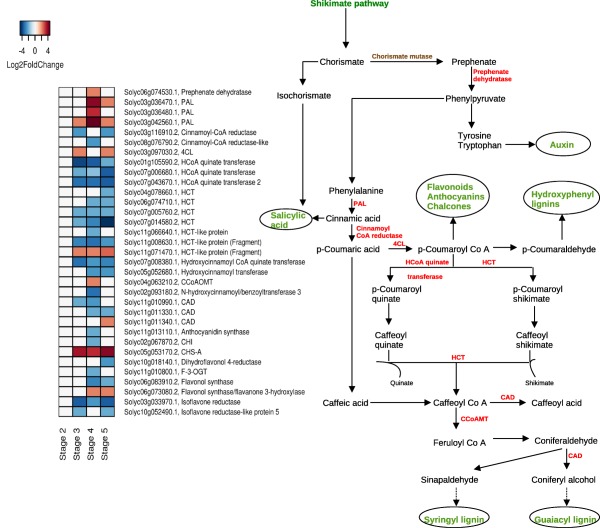
Figure 4.

Schematic representation of the gene expression patterns (left) of tomato differentially expressed genes (DEGs) involved in the phenylpropanoid biosynthetic pathway (right). Pathway showing DEGs (in red) and end products of pathways (in green) during the susceptible response. In the heatmap, each row represents a gene and each column represents a stage of disease development. Labels on the right of the heatmap show the gene id followed by the annotation. The colour key is given in the top‐left corner of the figure. 4CL, 4‐hydroxycinnamoyl CoA ligase; CAD, cinnamoyl alcohol dehydrogenase; CCoAMT, caffeoyl CoA‐O‐methyltransferase; HCT, hydroxycinnamoyl shikimate/quinate hydroxycinnamoyl transferase; HCoA, hydroxycinnamoyl Co A; PAL, phenylalanine ammonia lyase.
