Figure 5.

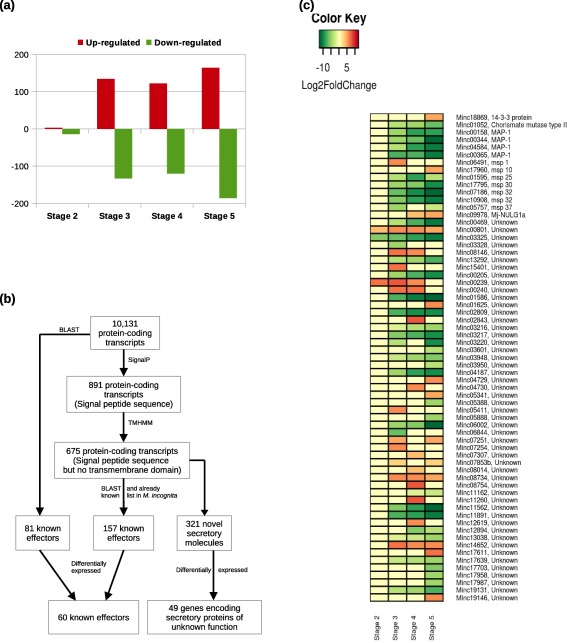
(a) Distribution of significant root‐knot nematode (RKN) differentially expressed genes (DEGs) detected at different stages of infection relative to stage 1 during the susceptible response. (b) Workflow summary of the bioinformatics strategy used to identify RKN candidate effector genes. (c) Schematic representation of the gene expression patterns of RKN DEGs reported to be involved in parasitism during the susceptible response. Each row represents a gene and each column represents a stage of disease development. Labels on the right show the gene id followed by the annotation. The colour key is given in the top‐left corner of the figure.
