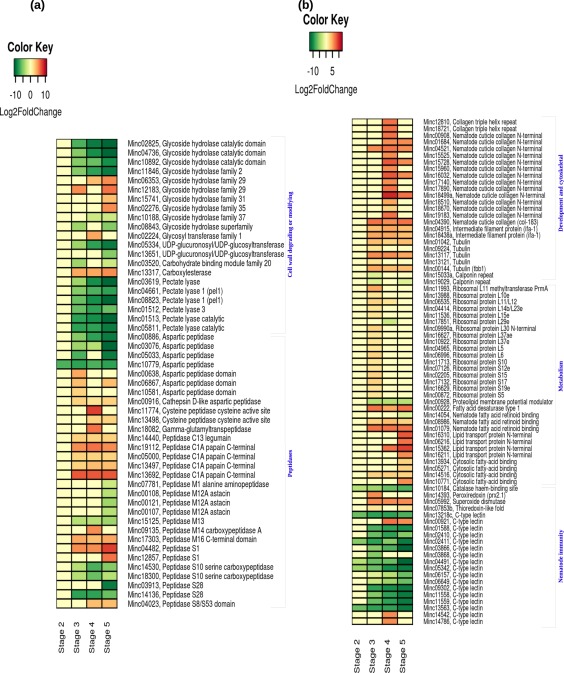
Figure 6.

Schematic representation of the gene expression patterns of root‐knot nematode (RKN) differentially expressed genes (DEGs) involved in cell wall degradation and peptidase encoding (a) and development, metabolism and nematode immunity (b), detected during the susceptible response. Each row represents a gene and each column represents a stage of disease development. Labels on the right side of the heatmap show the gene id followed by the annotation. The colour key is given in the top‐left corner of the figure.
