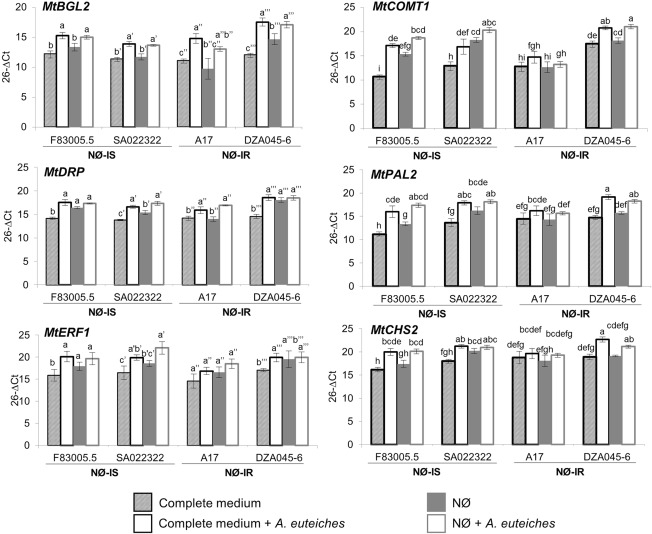
Figure 5.

Expression analysis of secondary metabolism and defence genes in the four selected genotypes. Gene expression levels were determined using MtERF1 as reference gene in roots of the four Medicago truncatula genotypes, F83005.5, SA022322, A17 and DZA045‐6, after 10 days of culture on complete medium or nitrate‐deficient (NØ) medium and inoculated or not with Aphanomyces euteiches. Error bars indicate standard errors (n = 4 biological replicates) and letters indicate significant differences (P < 0.05). NØ‐IS, genotype displaying NØ‐induced susceptibility; NØ‐IR, genotype displaying NØ‐induced resistance. MtBGL2, β‐1,3‐glucanase gene; MtDRP, disease resistance protein gene; MtCOMT1, chalcone‐O‐methyltransferase gene; MtPAL2, phenyl ammonia‐lyase gene; MtCHS2, chalcone synthase gene.
