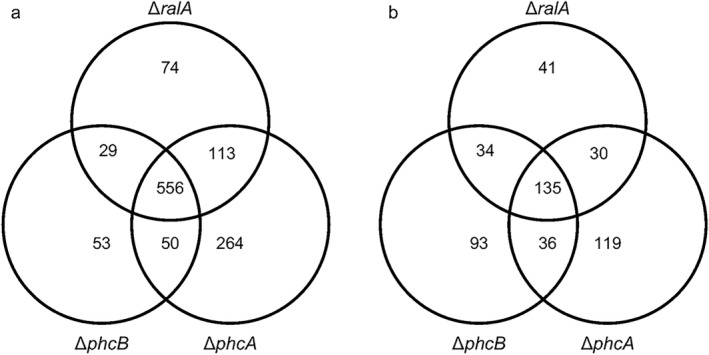
Figure 1.

Number of genes exhibiting expression level fold changes of ≤–2 (a) or ≥2 (b) in the Ralstonia solanacearum phcB‐deleted mutant (ΔphcB), phcA‐deleted mutant (ΔphcA) and ralA‐deleted mutant (ΔralA), relative to the expression levels of strain OE1‐1. The FPKM (fragments per kilobase of exon per million fragments mapped) values of strains OE1‐1, ΔphcB, ΔphcA and ΔralA were normalized prior to the analyses of differentially expressed genes.
