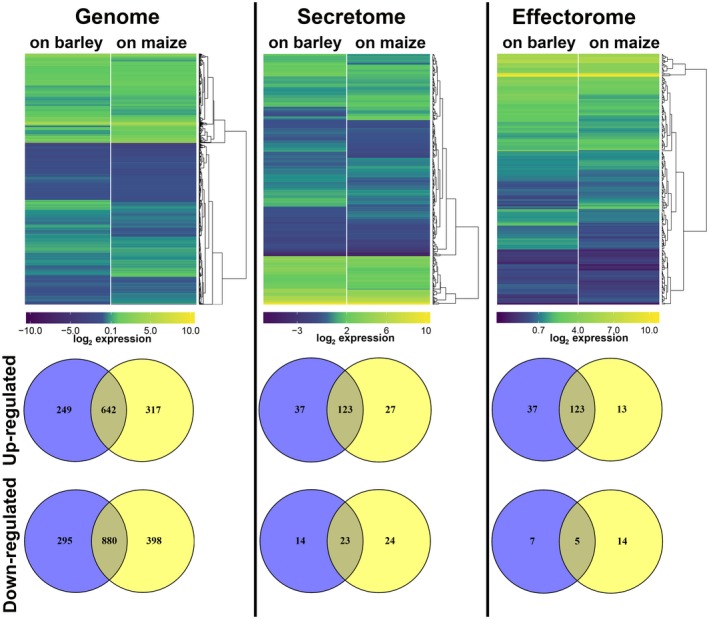
Figure 3.

The hierarchical relation heat map for microarray analysis of Ustilago hordei wild‐type on host barley and non‐host maize plants. The expression profiles of the whole genome, secretome and effectorome of U. hordei are depicted. Differentially expressed U. hordei genes which are up‐regulated (yellow) and down‐regulated (blue) in planta are shown as log2‐fold changes relative to in vitro axenic culture. Differentially expressed genes are plotted as Venn diagrams. [Colour figure can be viewed at wileyonlinelibrary.com]
