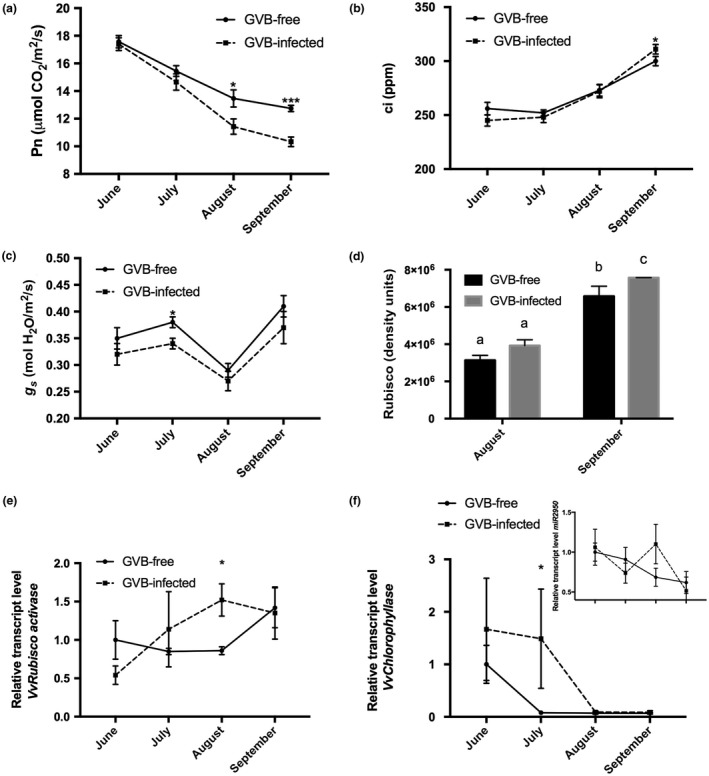
Figure 2.

Seasonal time course (2016) of carbon assimilation (net photosynthesis, Pn) (a), substomatal internal carbon concentration (substomatal CO2 concentration, ci) (b) and stomatal conductance (g s) (c) in grapevine virus B (GVB)‐free (full line, filled circles) and GVB‐infected (broken line, filled squares) ‘Albarossa’ plants. Data are expressed as the mean ± standard deviation (SD) (n = 6). (d) Ribulose‐1,5‐bisphosphate carboxylase/oxygenase (Rubisco) quantification (density units) in samples collected at the end of August and September from GVB‐free (black columns) and GVB‐infected (grey columns) plants. Data are expressed as mean ± SD (n = 3). Seasonal changes in the transcriptional profiles of (e) VvRubisco activase (VIT_13s0019g02050), (f) miR2950 (inset) and its target transcript VvChlorophyllase (VIT_07s0151g00110) measured by quantitative reverse transcription‐polymerase chain reaction (RT‐PCR) in GVB‐free (full line, filled circles) and GVB‐infected (broken line, filled squares) leaves. Data are expressed as mean ± SD (n = 3). Asterisks and lowercase letters denote significant differences between GVB‐free and GVB‐infected plants attested by two‐tailed Student’s t‐test and Tukey’s honestly significant difference (HSD) test (P < 0.05 or P < 0.01), respectively.
