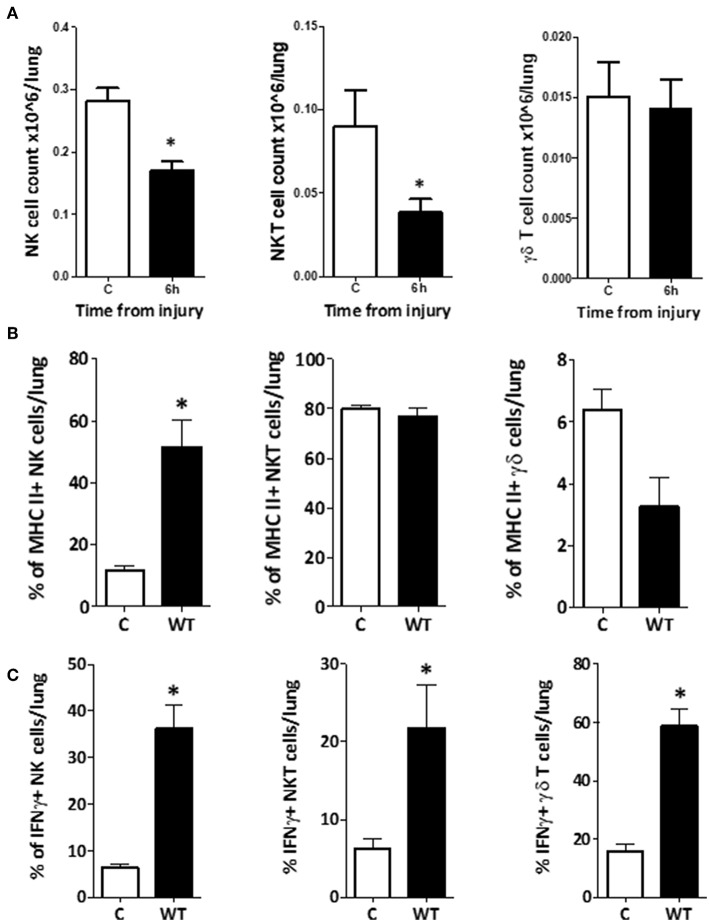
Figure 13.
Changes in phenotype and function of innate-like lymphocytes within lung, were comparatively delayed. (A) To investigate whether the innate-like lymphocytes within lung also displayed changes in phenotype or function after T&HS, flow cytometry of a single cell suspension of lung tissue was conducted using the same staining protocol. The total number of NK1.1+ CD3– and NK1.1+ CD3+ cells within the lung reduced by 6 h, but no change in γδ TCR+ CD3+ cells was demonstrated. Cell counts (× 106/lung): NK1.1+ CD3–: 0.28 (0.26–0.30) vs. 0.17 (0.15–0.18), p = 0.02. NK1.1+ CD3+: 0.09 (0.06–0.11) vs. 0.04 (0.03–0.04), p = 0.04. γδ TCR+ CD3+: 0.01 (0.01–0.02) vs. 0.02 (0.01–0.02), p = 0.89, n = 6–8. Control (C) represents a naïve subject of the same strain and age, n = 4–6. Data are presented as mean (SEM) and tested with a Mann Whitney test, *denotes p < 0.05. (B) NK1.1+ CD3– cells in lung tissue upregulated MHCII expression by 6 h following T&HS. Cell surface phenotype markers on NK1.1+ CD3–, NK1.1+ CD3+, and γδ TCR+ CD3+ cell populations were examined in lung tissue, using flow cytometry at 6 h following injury. The NK1.1+ CD3– cell population demonstrated upregulation of MHC II, while NK1.1+ CD3+ MHCII expression remained the same. γδ TCR+ CD3+ cells appeared to downregulate MHCII, although this did not reach significance. NK1.1+ CD3–: C vs. 6h: 12 (2) vs. 52 (9), p = 0.02. NK1.1+ CD3+: C = 80 (2) vs. 77 (4), p = 0.56. γδ TCR+ CD3+: C = 6 (1) vs. 3 (1), p = 0.09. Control (C) denotes a naïve subject of the same strain and age (n = 4–6). Data are presented as median (IQR) and tested with a Mann Whitney test, *denotes p < 0.05. (C) NK1.1+ CD3–, NK1.1+ CD3+, and γδ TCR+ CD3+ cells within lung tissue, all demonstrated an increase in the % of IFNγ+ cells by 6 h following T&HS. To assess activity of innate-like lymphocytes within lung tissue, intracellular IFNγ, TNFα, and perforin were examined using flow cytometry. At 6 h following T&HS more NK1.1+ CD3–, NK1.1+ CD3+, and γδ TCR+ CD3+ cells within lung tissue, were positive for IFNγ compared with their naïve state. No change in TNFα or perforin production was observed. Control (C) denotes a naïve subject of the same strain and age. C vs. 6 h: NK1.1+ CD3– = 6 (1) vs. 36 (5), p = 0.02, NK1.1+ CD3+ = 6 (1) vs. 22 (6), p = 0.02, γδ TCR+ CD3+ = 16 (2) vs. 59 (6), p = 0.02. n = 6–8 and data are presented as median (IQR) and tested with a Mann Whitney test, *denotes p < 0.05.

