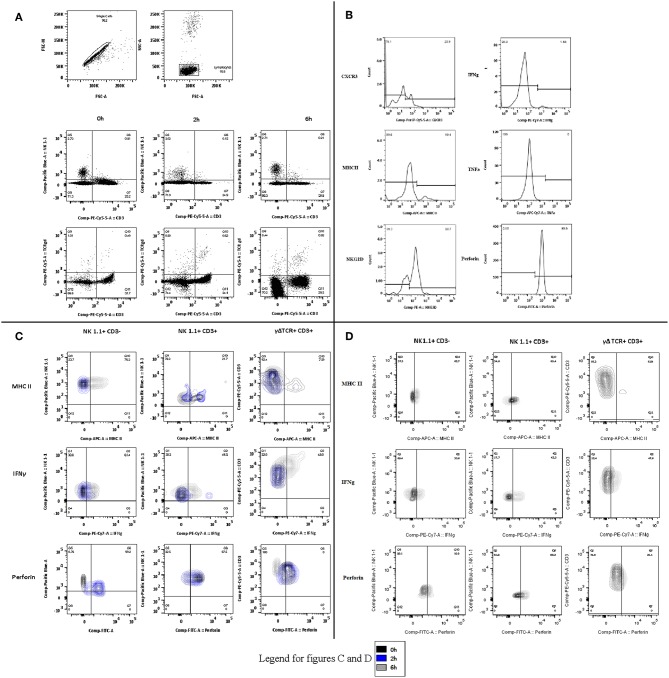
Figure 2.
Phenotype and function flow cytometry gating strategies (A) Gating strategies for phenotype and function experiments in blood, spleen, and lung. Following identification of single cells, the lymphocyte population was selected and divided by CD3 and either NK1.1 or TCRγδ. Representative plots are displayed for 0, 2, and 6 h. (B) Phenotype and function. The phenotype markers (CXCR3, MHCII, and NKG2D) and functional markers (Intracellular IFNγ, TNFα, and perforin) were then examined and recorded as percentage of positive cells for each lymphocyte subset. Representative histograms are displayed. (C) Changes in blood over time. Contours plots were overlaid to demonstrate the shifts in phenotype and function within each lymphocyte subset at the different sample points in the protocol. Representative plots of NK1.1 CD3–, NK1.1 CD3+, and CD3 TCRγδ are displayed for blood-borne cells at 0, 2, and 6 h. (D) Lung lymphocytes. As in (C), the same process was followed to demonstrate the changes by cell type over time, in this case only Control and 6 h.

