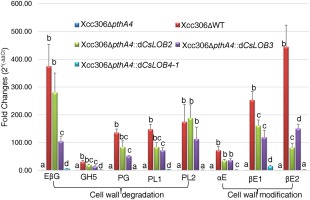
Figure 7.

Quantitative reverse transcription‐polymerase chain reaction (RT‐PCR) validation of cell wall‐related genes induced by the expression of CsLOB1, CsLOB2, CsLOB3 and CsLOB4. RNA samples were grapefruit leaves treated with various Xanthomonas citri ssp. citri (Xcc) strains as indicated in the figure, and were taken at 5 days post‐inoculation (dpi). Inoculum had an optical density at 600 nm (OD600) of 0.5. Expression values were normalized to the housekeeping gene orange1.1g001725m. Error bars represent the standard error for three independent experimental replicates. Different letters indicate significant differences among the various treatments for each test gene at the significance level of P < 0.05 according to analysis of variance (ANOVA). Different genes are represented by abbreviations of the annotations of various transcripts. Gene IDs are from Phytozome. EβG, endo β‐1,4‐glucanase (orange1.1g009690m); GH5, glycosyl hydrolase family 5 (orange1.1g014426m); PG, polygalacturonase (orange1.1g043061m); PL1, pectate lyase1 (orange1.1g015623m); PL2, pectate lyase2 (orange1.1g011814m); αE, α‐expansin (orange1.1g024916m); βE1, β‐expansin1 (orange1.1g023962m); βE2, β‐expansin2 (orange1.1g024303m).
