Figure 2.

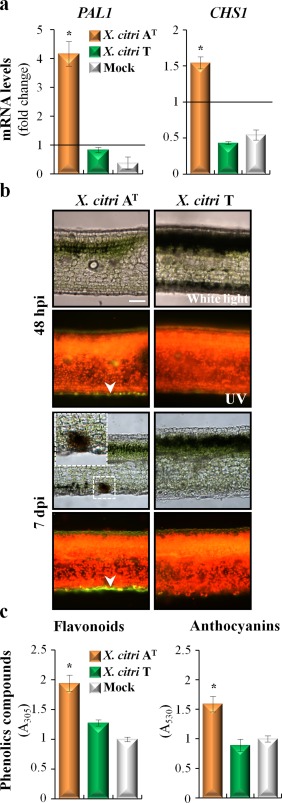
Phenolic compounds are involved in the Citrus limon response to Xanthomonas citri ssp. citri (X. citri) strain AT. (a) Quantitative reverse transcription‐polymerase chain reaction analysis of phenylalanine ammonia lyase (PAL1) and chalcone synthase (CHS1) mRNAs measured at 48 h post‐inoculation (hpi). The relative gene expression (ΔΔCt) fold change of mRNA levels was performed considering non‐treated plants as reference samples and a histone H4 transcript as an endogenous control. Values are expressed as means ± standard deviation (SD) from three independent biological replicates. The dataset marked with an asterisk is significantly different as assessed by Tukey's test (P < 0.05). (b) Light microscopic images of lemon leaves inoculated with X. citri strains. Leaves were photographed at 48 hpi and 7 days post‐inoculation (dpi) under white and UV light. Green fluorescent polyphenolic compounds (arrows) and red chlorophyll fluorescence are observed. The presence of discrete black spots in the C. limon–X. citri AT interaction is shown enlarged in the top inset. Scale bar, 10 µm. (c) Spectrophotometric determination of flavonoids and anthocyanins at 48 hpi. Values are expressed as means ± SD. Each sample consists of 10 leaf discs (0.5 cm in diameter) obtained from two shoots of three different plants, and 10 biological replicates were performed. The dataset marked with an asterisk is significantly different as assessed by Tukey's test (P < 0.05). A, absorbance.
