
Figure 2.
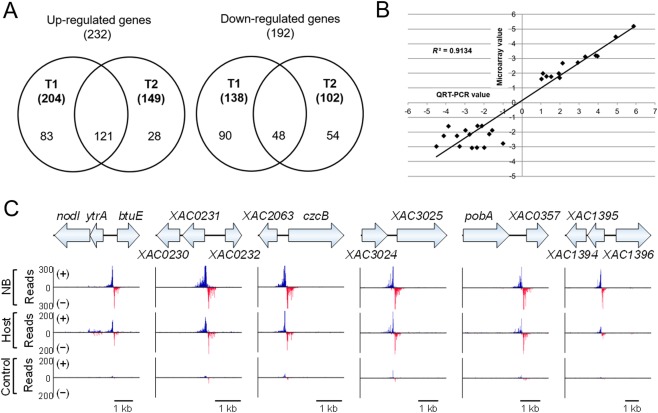
YtrA regulon and DNA binding sites. (A) Venn diagram shows the overlap of genes differentially regulated by YtrA at the two time points (T1, T2). (B) Validation of the microarray data by quantitative reverse transcription‐polymerase chain reaction (QRT‐PCR). The relative expression of 28 genes determined by microarray and QRT‐PCR was compared. The R2 value is shown. (C) Six putative YtrA DNA binding sites identified by chromatin immunoprecipitation‐exonuclease (ChIP‐exo) experiments in nutrient broth (NB) and host plant. Strain expressing YtrA without a tag was used as a control. (+) (blue) and (–) (red) in ChIP‐exo data indicate reads mapped on forward and reverse strands, respectively.