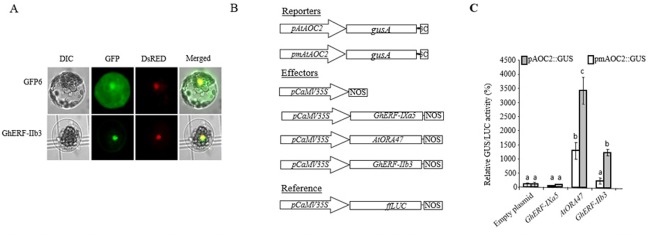
Figure 4.

Transient overexpression of Xanthomonas citri pv. malvacearum (Xcm)‐inducible nuclear transcription factor (TF) GhERF‐IIb3 transactivates the AtAOC2 promoter in Arabidopsis thaliana cells. (A) Subcellular localization of the TF green fluorescent protein (GFP) fusions GhERF‐IIb3‐GFP in A. thaliana leaf protoplasts. GhERF‐IIb3‐GFP and NtKISa‐DsRED constructs were transformed simultaneously in protoplasts. The differential interference contrast (DIC) images are shown on the left, epifluorescence microscopic images are shown in the middle and merged images are shown on the right. (B) Schematic representation of the constructs used for promoter transactivation assays in A. thaliana protoplasts. The reporter construct consisted of the uidA gene driven by the AtAOC2 promoter [or AtAOC2 mutated promoter (pmAtAOC2) as described by Zarei et al. (2011)]. The effector constructs consisted of an expression vector carrying the CaMV35S promoter upstream of the GhERF‐IIb3, AtORA47 or GhERF‐IXa5 cDNAs. Empty effector vector was used as a negative control. The firefly luciferase (LUC) gene fused to the CaMV35S promoter served as a reference gene to correct for differences in transformation and protein extraction efficiencies. The firefly luciferase coding sequence (ffLUC) driven by the promoter CaMV35S was used as an internal control. (C) AtAOC2 promoter transactivation by the transcription factors GhERF‐IIb3 and AtORA47 in plant protoplasts. Bars represent average GUS/LUC ratios from triplicate experiments (±standard deviation) expressed relative to the vector control set at 100% (n = 6). Letters above the bars indicate distinct statistical groups as calculated by one‐way analysis of variance (ANOVA) (P < 0.01).
