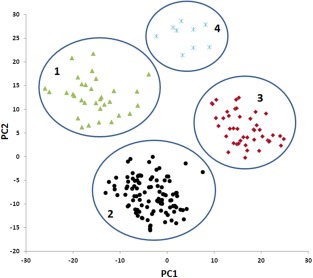
Figure 5.

Principal component analysis (PCA) of 179 alfalfa lines (each represented as a data point) using the marker data generated by genotyping‐by‐sequencing (GBS). The first and second principal components (PC1 and PC2) were used to construct the scatter plot. Each data point represents a genotype. Clusters 1, 2 and 3 contain lines from breeding programmes Midwest (MW), Pacific Northwest (PNW) and California (CA), respectively. Cluster 4 contains nine lines diverged from CA.
