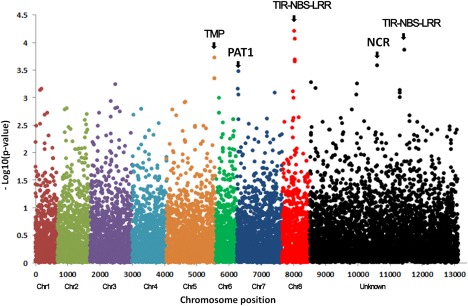
Figure 6.

Manhattan plot displaying the results of genome‐wide association (GWA) mapping for Verticillium wilt resistance in the Forage Genetics International populations. Each dot represents a single nucleotide polymorphism (SNP). A false discovery rate of 5% was used for significant cut‐off. Significant markers above the cut‐off value of –log P = 3.5 were identified to be associated with Verticillium wilt (VW) resistance and are listed in Table 2. The chromosome position was based on the reference genome of Medicago truncatula (Mt4.0 v1). Each chromosome is numbered and ‘Unknown’ represents the unknown chromosome. The chromosomal positions are distinguished by colour. The abbreviations at the top of the plots are putative candidate genes linked to corresponding SNPs, and the arrows indicate their genetic positions in the reference genome. TMP, putative transmembrane protein; PAT1, scarecrow‐like transcription factor PAT1; TIR‐NBS‐LRR, toll interleukin‐1 receptor‐nucleotide‐binding site‐leucine‐rich repeat protein; NCR, nodule cysteine‐rich (NCR) secreted peptide.
